For all its imperfections, the Capital Asset Pricing Model (CAPM) remains the most widely used framework for estimating the cost of equity. Yet the way the CAPM's beta is typically measured has a fundamental weakness: a mechanically calculated beta can be statistically correct and still be economically misleading. When the market index used to estimate beta becomes heavily weighted by a small group of companies, historical betas become distorted even though industry fundamentals haven't changed. While no approach is perfect, our research finds that betas measured against an equal-weighted market index are markedly more stable through time. Where a single estimate is needed, that is the one we would look at.
Industry fundamentals are stable. Measured betas often are not.
Beta should reflect the future expected risk of a company or industry, not a mechanical calculation based on the past. Traditionally, beta has been estimated using the historical relationship of a company to a market index, often the last 60 months, based on the idea that the historical beta is the best predictor of future risk.
For some companies and industries, the traditional approach produces betas that swing by nearly a third over a fifteen-year period, even where there is little evidence that the underlying economics or business risk of the industry have changed. This is not confined to a handful of outliers: of the 86 industries we examined, 51 showed swings of more than 20% across the period. Exhibit 1 shows three of them.
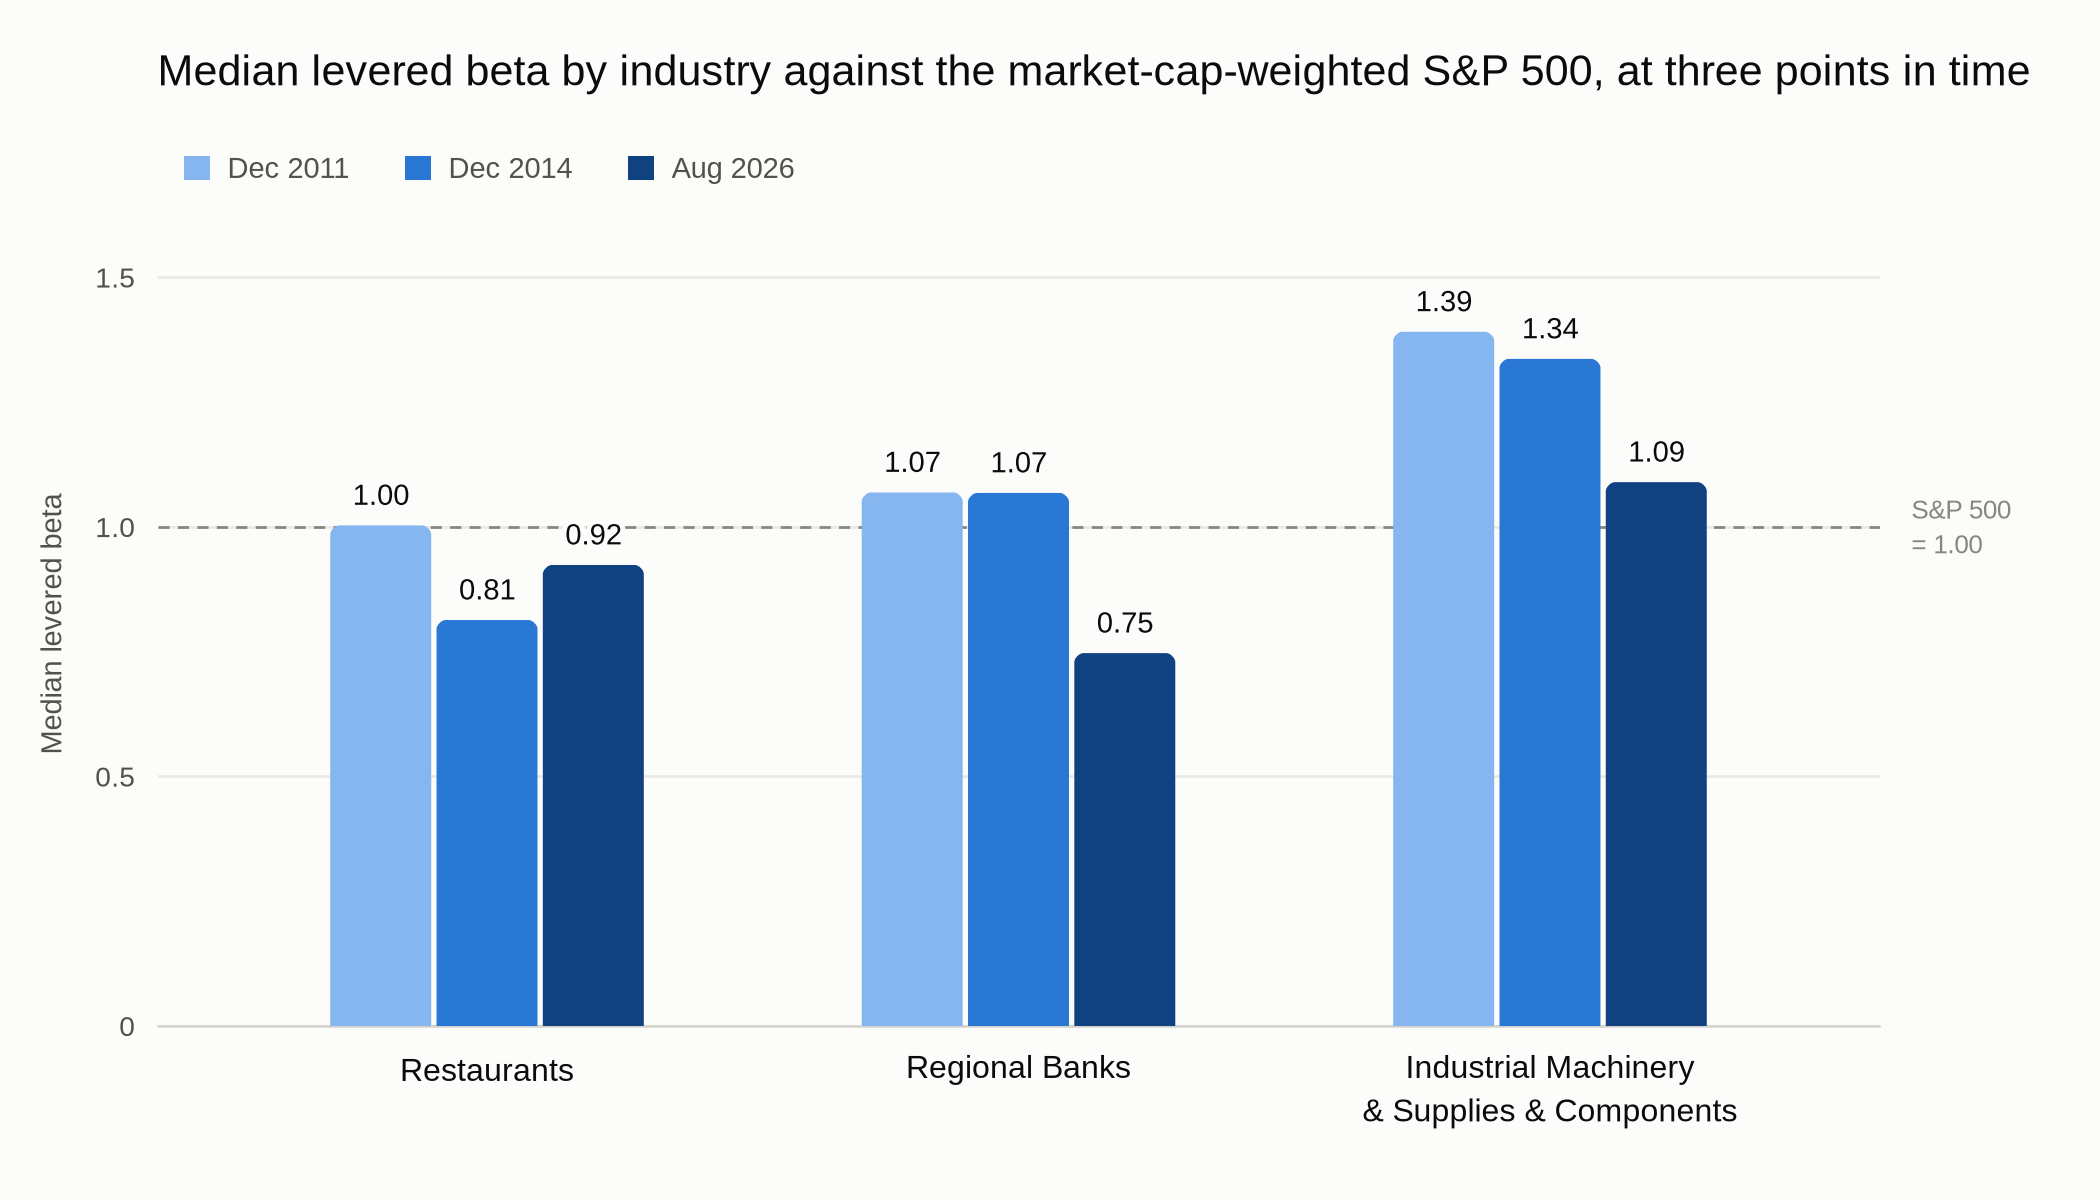
If an industry's business model, operating leverage, cyclicality, competitive structure, and exposure to the economic cycle have remained broadly similar, why should its systematic risk relative to the market move so significantly? It shouldn't. The problem is that the benchmark itself has changed. When a relatively small number of mega-cap companies account for a substantial portion of index movements, and those companies exhibit return patterns that differ from the rest of the market, they change the statistical benchmark against which every other company's beta is measured.
A better approach
Rather than measuring betas only against the traditional market-cap-weighted S&P 500, we suggest running the regression against an equal-weighted benchmark, in which each constituent contributes equally to the index. Because no single company can then dominate the benchmark's movements, the resulting beta reflects how a company covaries with the broad market rather than with the handful of names that happen to be leading it. Measured this way, the same industry betas hold far steadier from one period to the next (as shown in exhibit 2).
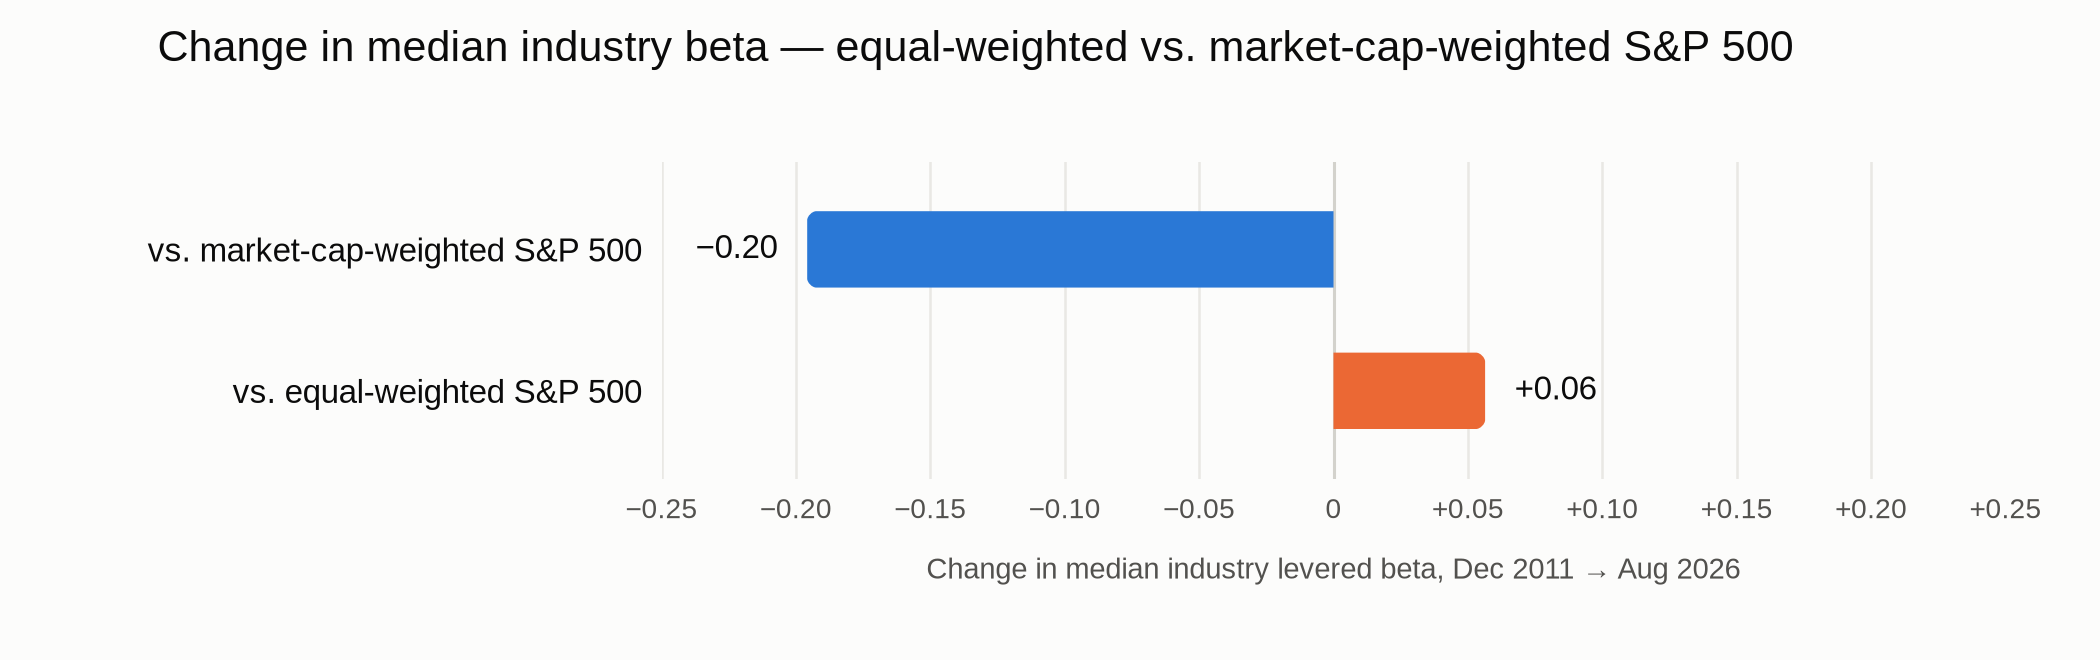
A value-weighted index is the closer analogue to CAPM's market portfolio in principle, but that portfolio is unobservable and the S&P 500 is only a proxy for it — so the question is less which index is theoretically correct than which proxy behaves better as a basis for estimating forward-looking risk. On the evidence, the equal-weighted index does.
That is the practical case for starting from the equal-weighted regression rather than the cap-weighted one. It should still inform the beta an analyst ultimately chooses rather than be dropped mechanically into a cost of equity built on a market-cap-weighted risk premium. Running both remains a useful check: if the two broadly agree, the estimate is unlikely to be an artifact of index composition, while a material divergence in an industry whose economics have changed little is itself the finding — a signal to look harder rather than to accept the most recent regression output as the forward-looking assumption.
Why getting beta wrong matters
Beta can sometimes receive less attention in a valuation than assumptions for revenue growth, margins, or capital intensity, but its impact can be just as significant. Consider a company in a relatively defensive industry (such as consumer packaged foods), where the economics and long-term history suggest a reasonable beta of around 0.6. Now imagine that a mechanical historical regression instead produces a beta closer to 0.8.
Nothing else in the forecast has changed: revenue growth, margins, reinvestment, and cash flows remain exactly the same. Yet the higher beta raises the estimated cost of equity and, in turn, the cost of capital, and because every future cash flow is now discounted at a higher rate, the estimated value falls.
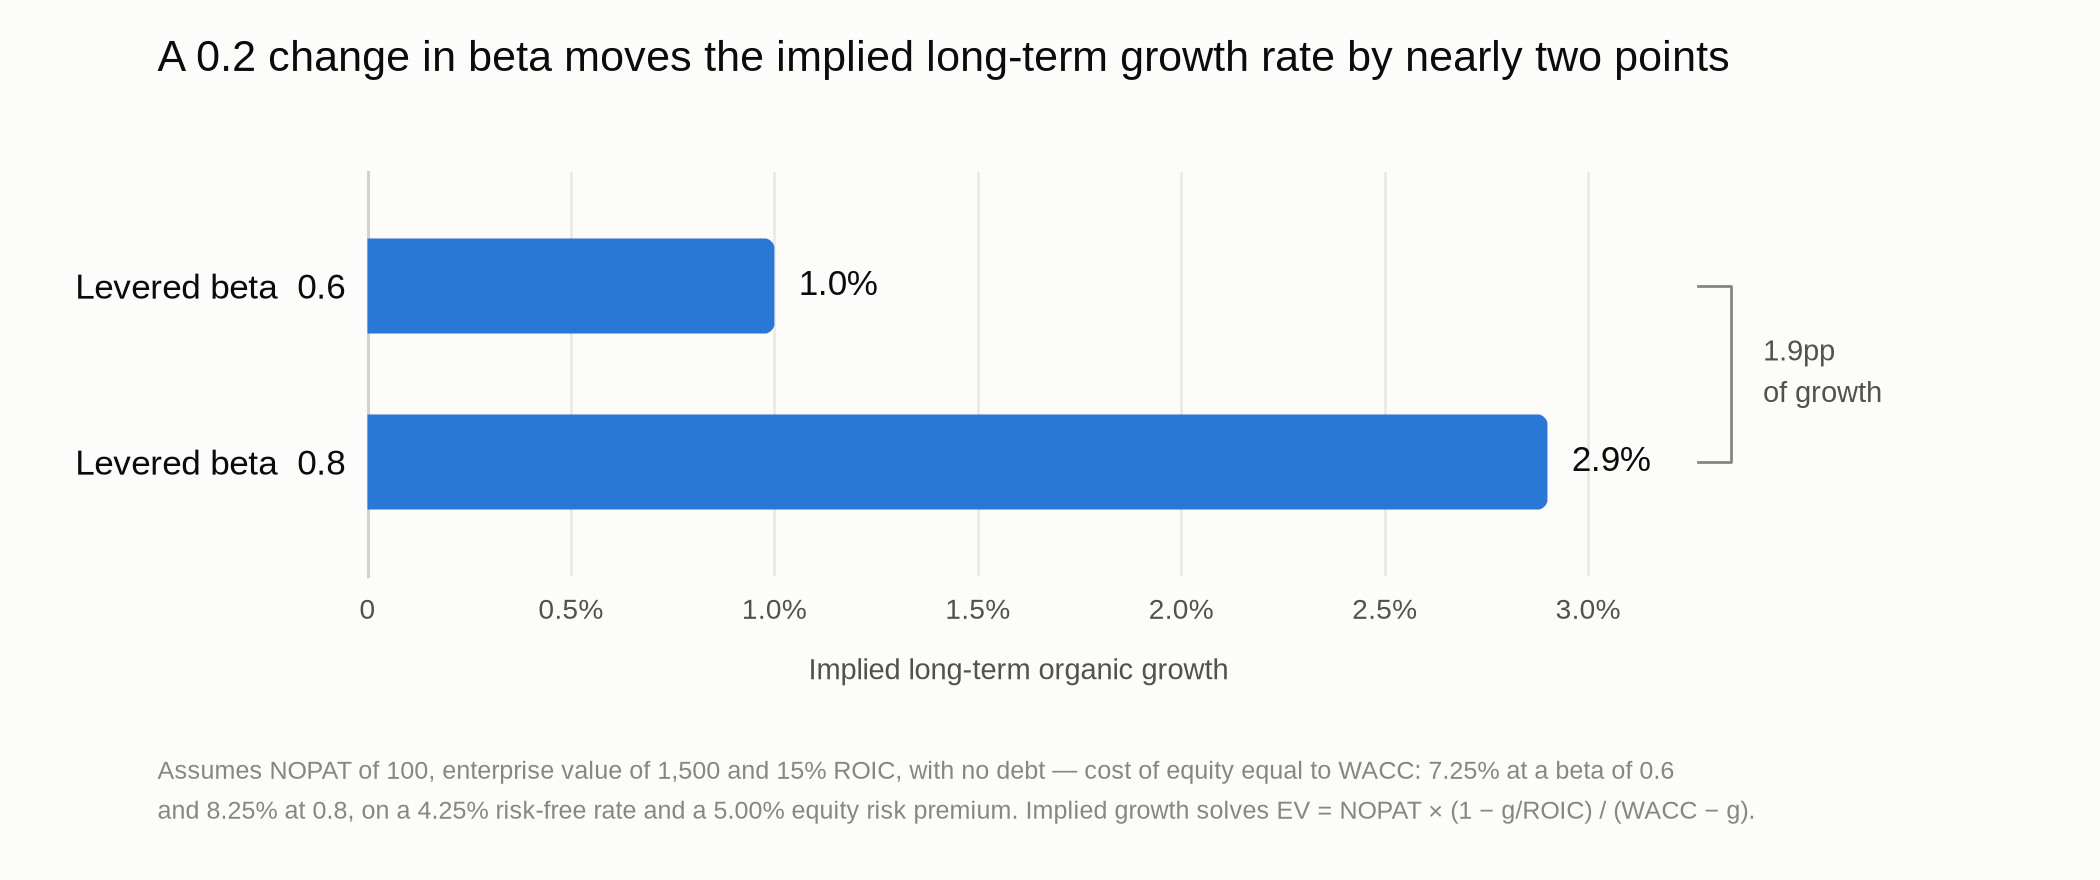
The magnitude is easy to underestimate. Turning the question around — holding today's valuation constant and asking what it would take to justify it — exhibit 3 shows the long-term organic growth implied at each beta. For a company trading at 15 times NOPAT and earning a 15% return on invested capital, a levered beta of 0.6 implies long-term organic growth of 1.0%, while a beta of 0.8 implies 2.9%. A 0.2 difference in beta — well inside the range a regression can move on benchmark composition alone — shifts the growth rate the valuation is implicitly assuming by nearly two percentage points.
The reverse is equally important. An artificially low beta can make the same business appear more valuable than its economics support, or imply that a weaker growth or margin trajectory is enough to justify its current share price.
This is why the question is not merely whether a beta regression has been calculated correctly. The more important question is whether the output is economically sensible as an estimate of future risk. Financial theory requires beta to represent expected sensitivity to systematic market risk going forward, and a regression delivers that only when the historical window is representative and the benchmark behaves normally. A historical beta should therefore be treated as evidence, not as an answer.
Interpretation beats false precision
Beta will never be a perfect measure of risk, and CAPM will never be a perfect model of the cost of equity. But that does not make the exercise irrelevant. Quite the opposite: because the cost of capital has such an important influence on valuation, its inputs deserve the same scrutiny we routinely apply to growth, margins, and returns on capital.
The solution is not to abandon the traditional methodology; it is to stop treating a single regression as the answer. Look at beta through time, run it against a second benchmark, understand what is driving any difference, and use judgment to choose an assumption that makes sense for the economics of the business going forward.
At ValueLens, this is the principle we apply more broadly to valuation: rigorous analysis should not stop at calculating a number. It should test whether that number tells a coherent economic story.
If you would like to see what our research shows for your own industry, get in touch.
Want to see what our research shows for your own industry?
Get in touch